Completed UT Austin postgraduate coursework using a supplied scenario, dataset, and starter notebook. The charts below come from my completed notebook.
E-news Express
Experimental analysis and hypothesis testing
pandas, NumPy, SciPy, statsmodels, Seaborn, Matplotlib
The supplied data
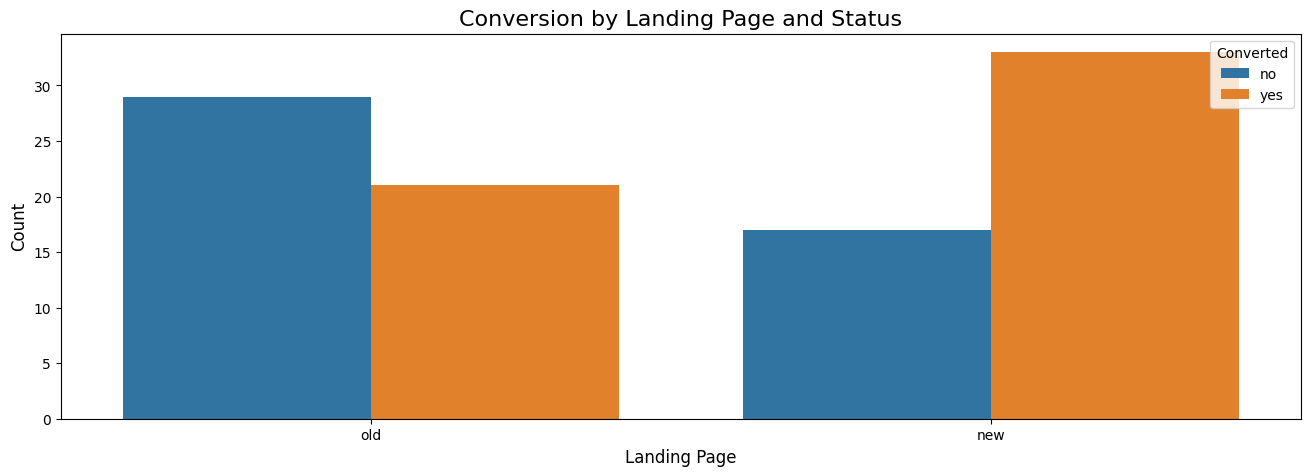
The supplied experiment randomly assigned 100 visitors to an existing or redesigned landing page. Each record contained the page version, time spent, subscription outcome, and preferred language. The task was to compare engagement and conversion, then explore whether the result varied by language.
What I did
- Checked the data, summarized page and language groups, and plotted engagement and conversion.
- Used an independent-samples t-test for time on page and a two-proportion z-test for conversion.
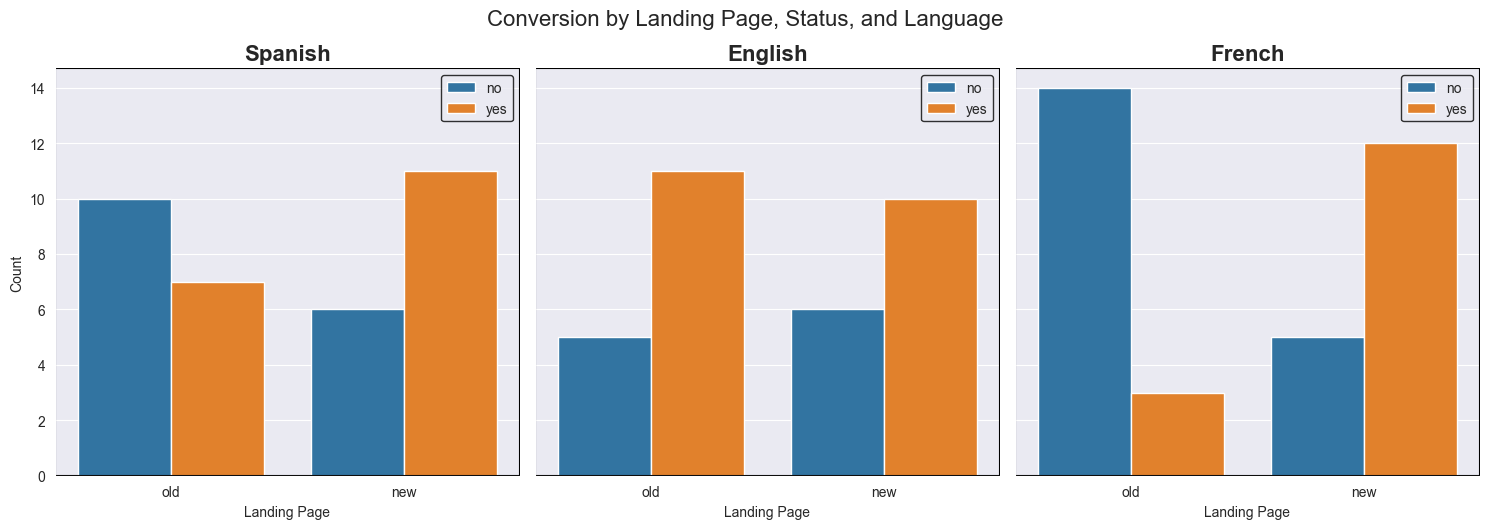
- Used a chi-square test and ANOVA for the two language questions, then reviewed segment patterns alongside the overall result.
Finding in the course dataset
The new page showed higher average time and conversion overall. The English-language subgroup was an exception on conversion, so my recommendation was to inspect the page content and test another iteration before a broad decision.
Learning reinforced
This project connected business questions to the right statistical tests and showed why a statistically significant overall result still needs careful segment review and plain-language interpretation.
Original notebook export
View the complete HTML report, including code, outputs, and the original written analysis.